The morning read,
before the athletes
walk in.
It sits on top of the software you already run. It reads the reports your systems already export, flags who has drifted from their own baseline, and sends one short message before the session. Thirty seconds to read. It surfaces who to check. It never predicts injury.
It reads what you already run.
It reads the reports your systems already produce. If a system has an API, it pulls from it. If it only exports a file, it reads the file. Each connection is a small adapter, written once. You rip out nothing, buy nothing new, and your staff learns nothing new.
The kinds of systems it’s built to read from. No rip-and-replace. No new dashboard to log into.
The morning scramble.
Before every session, a sports scientist pulls the force plates, pulls the GPS, pulls the wellness form and the HRV export, reconciles names that never match across systems, and tries to have a read before the athletes walk in. That manual synthesis is the hidden tax on the job.
Across a season it is the better part of two work-weeks — a specialist’s time spent moving numbers between tabs instead of coaching, and a read that too often lands late or as a spreadsheet nobody opens.
- Pull force plates
- Pull GPS / load
- Pull wellness
- Pull HRV
- Reconcile names
- Eyeball who moved
Illustrative of a typical morning — not a client measurement. The point is where a specialist’s hours go, and where they could go instead.
What you’re looking at — the one message the staff gets each morning. Shown as it lands in Slack.
Nine athletes in this morning. Three flagged against their own baselines — one on two systems at once, two on a single domain. The rest are within their normal range.
Wellness and RSI-mod (jump/reactive strength) are both down against his own 28-day baseline — two systems moving together the morning after a heavy week (ACWR 1.52, context only). Worth a conversation before he throws.
HRV — read as the 7-day rolling average, not a single reading — has drifted below his baseline (z −1.8). Workload has been normal, so this is not load. Eyes on him this week.
Third straight session of declining jump output (RSI-mod z −1.4). Not past the review line, but the trend is one direction. Recheck after his day down.
That’s the whole daily read. Thirty seconds, before anyone walks in. The dashboard below is only there when someone asks “why.”
From four streams to one decision.
Follow the path from data to decision. Code does every calculation. The model only phrases what the engine already computed — and never sees a real name.
Context, not a flag Training load and ACWR enter the engine to explain the “why” behind a change. They never set a status on their own.
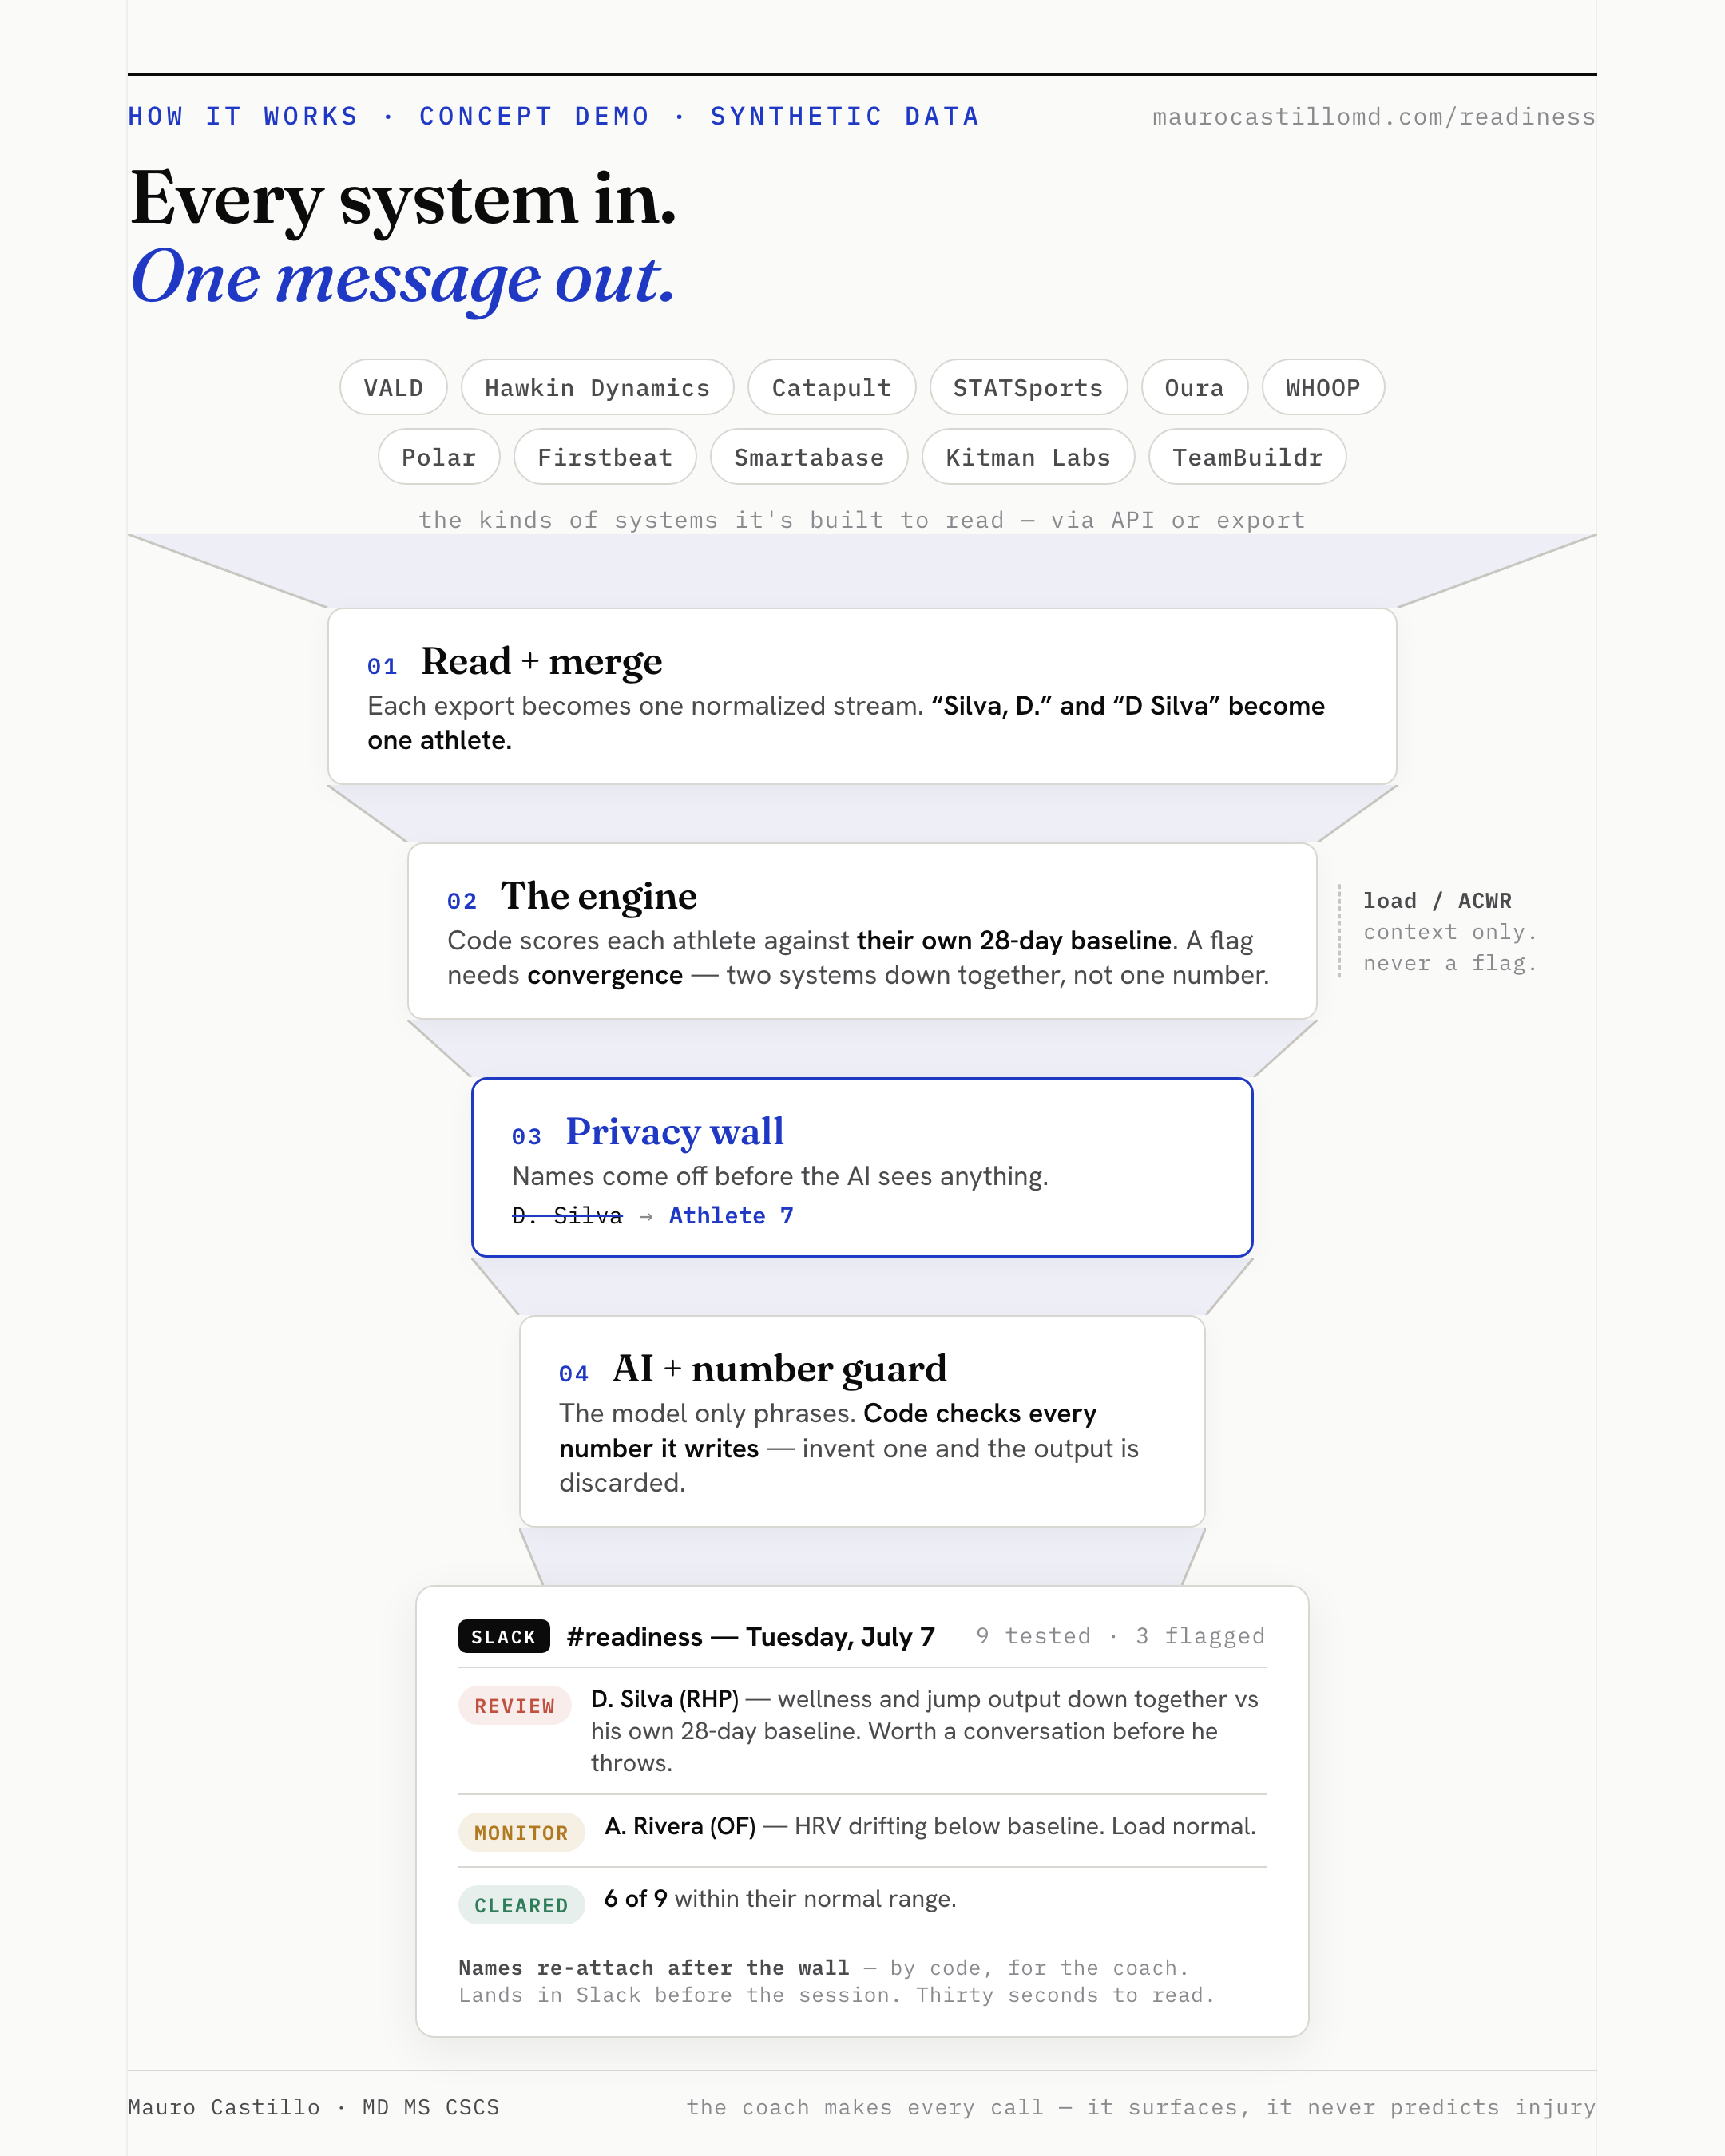
The whole system on one page — ending where your staff already lives: Slack. Click to open full size.
The full board.
Every athlete, three response domains, each measured against that athlete’s own 28-day baseline. A flag comes from convergence — domains agreeing — not one metric. The dots by each status show how many systems are down. Load is context; it never flags.
And once a week, the whole picture.
The same engine rolls the week into a report a coach reads in one sitting — who was flagged, by which system, and where next week’s risk is trending. Print-to-PDF, one command.
Of the nine athletes this week, six came back clear and three were flagged, with no one on watch. A. Rivera (OF) is the largest concern — flagged four of the days with readiness below baseline (z −1.21, down 1.14 from last week), driven by autonomic markers. R. Bennett (C) was flagged two days on a neuromuscular driver with a downward trend (z −0.84). D. Silva (RHP) was flagged one day, under review, on perceptual and neuromuscular signals together.
Generated by the same engine — ./report.sh. Every number verified; the AI never writes one.
The half-day back isn’t the point.
What you do with it is.
The conversation, before he trains
The flag lands before the session, not in a report next week. You catch the drift while there is still something to do about it.
The adjustment, made on time
A programming change when the data says so — a lighter day, a moved rep scheme — instead of finding out at the next test block.
Hours back on the floor
The morning synthesis stops eating a specialist’s time. That is a half-day a week back to coaching, where the value actually is.
The architecture, honestly.
A performance staff runs a dozen data sources. The job is to make them talk, keep the athletes’ data locked down, and draw a hard line between what code does and what the AI does.
Every stream, one source of truth
Wellness forms, HRV wearables, VALD / Hawkin force plates, Catapult / GPS load — anything with an export or an API. Each stream is designed to be read on its own cadence and merged on the athlete, even when three systems spell his name three different ways. No more six tabs.
A flag needs agreement, not one metric
Each domain is scored against the athlete’s own 28-day baseline. A single soft reading is a monitor; two systems down together is a review. Convergence is the signal — it is much harder to fool than any one number.
Names come off before the model
Athlete health data is governed by the CBA, not by enthusiasm. Every name is stripped to a token before the AI touches anything. Code re-attaches it after. It can’t leak what it never sees — and it runs on infrastructure the team’s IT signs off on, access locked by role.
Code does the math, the AI does the words
Every z-score and threshold is computed by code the staff can read and audit. The model never calculates — it takes a fact that is already true and says it plainly. Every number it writes is checked against the engine; invent one and the output is thrown away.
Load is context, never a verdict
Training load and ACWR travel with every flag to explain it — but they never set a status. The workload literature is clear that ACWR does not predict injury, so it is shown, not obeyed.
The AI never writes a number. Code reads the data and applies the threshold your staff already trusts. The model only takes a fact that’s already true and says it simply.
Watch it run.
Produced end to end by the real system. One command reads the synthetic squad’s raw sessions. The engine computes every baseline, every z-score, every flag. Names come off. Claude phrases the notes. Every number in its output is checked against what the engine computed — then the brief posts to Slack.
This clip shows an earlier single-metric version of the brief — the engine has since moved to the multi-domain read above. Re-render pending.
Simple to run. Simpler to understand.
There is nothing to migrate and nothing for your staff to learn. It reads what you already collect. Standing it up is a conversation, not a project.
Point it at what you already collect
Name your systems. Each one gets a small adapter that reads its export or API — written once, then it just runs. Nothing changes for your staff, and nothing gets ripped out.
It learns each athlete’s own baseline
Twenty-eight days of their own data — not squad averages, not generic thresholds. A change only counts against their own normal.
The brief lands in your Slack
Every morning before the session. Thirty seconds to read, then you go coach. The weekly report writes itself on Fridays.
The whole thing is real code, not slides. On the synthetic squad, one command —
./run.sh — prints the morning brief, and ./report.sh writes the
weekly report. It runs end to end today, on invented data, so you can watch the pipeline
work before a single real number is involved.
- It surfaces availability — it never predicts injury. No screening test predicts individual injuries with useful accuracy. This flags meaningful, individual change so a human acts earlier. The coach and medical staff make every call.
- The AI never does the math. Code computes every z-score and applies every threshold — deterministic, auditable, the same line the staff would draw by hand. The model only phrases a fact that is already true, and every number it writes is verified against the engine.
- A flag needs convergence, not one metric. Three domains — neuromuscular, autonomic, perceptual — each against the athlete’s own 28-day baseline. Two down together is a review; one is a monitor. Agreement is far harder to fool than a single number.
- Athlete data is anonymized before the model sees it. Names stripped to a token, re-attached by code afterward, running on infrastructure the team’s IT signs off on with access locked by role.
- Load and ACWR are context, never a predictor. They help interpret a change; they never trigger a flag on their own.
- Subjective wellness tracks load with more sensitivity than objective markers. Saw, Main & Gastin. Br J Sports Med, 2016.
- HRV, read as a rolling average, moderates how load is tolerated. Williams et al. J Sports Sci Med, 2017.
- CMJ strategy metrics detect fatigue that jump height hides. Gathercole et al. J Strength Cond Res, 2015.
- There is no evidence for ACWR in load management — a flawed ratio. Impellizzeri et al. Int J Sports Physiol Perform, 2020.
- Screening tests do not predict individual injuries. This surfaces; it never forecasts. Bahr. Br J Sports Med, 2016.
This is a working concept on synthetic data — the athletes and numbers are invented. Built by me to show how the data a performance staff already collects can become a decision, not just a dashboard.
Talk about building this for real